Layer Styling
Using QGIS, you can control many visual aspects of your layer. You may apply a common style for all the features in a layer (Single Symbol) or apply a thematic style that displays features according to any of its attributes (Categorized).
WMS Layers
When Pozi displays a WMS layer (ie, not WFS/vector), the rendering of the layer is done by QGIS Server.
The layer will display exactly as it appears in QGIS Desktop.
Vector Layers
When Pozi displays a vector layer (ie, WFS), the rendering and styling are done in the browser. This can sometimes cause the layer to appear differently compared to QGIS for some styling options.
To ensure maximum compatibility with QGIS when working with vector layers, use only the supported styles specified below.
(If you need to style layers using a QGIS style that doesn’t appear in the below lists of supported styles, disable WFS for the layer to force Pozi to retrieve the layer via WMS, which uses the QGIS Server renderer.)
Points
Supported marker symbols:
- Simple Marker:
square,circle,triangle,star,cross,x, etc… - SVG Marker
- QGIS default SVG icons
- FontAwesome Pro 6 icons
Suggested sizes:
- set the size to
4mmor greater to make feature interaction easier in the browser - set the stroke to white,
0.5mmor greater, to provide separation from the background
Lines
Supported lines:
- Simple Line
- Solid Line
- No Pen
- Custom Dash Pattern
Set line thicknesses to 2mm or greater to enable users to easily select line features.
To style a line with dots and/or dashes:
- set the cap style to
flat - tick “Use custom dash pattern”
- specify a dash pattern (eg,
4 2) in millimetres.

Polygons
Supported fills:
- Simple Fill:
Solid,No brush,Horizontal,Vertical,Cross, etc… - Point Pattern Fill
Ensure your polygons remain interactive
If the polygon fill style is set to ‘No brush’, Pozi will not detect the polygon as a selectable feature, and the cursor will not change to the ‘pointer’ cursor when hovering over the polygon.
If you want to display a polygon with a transparent fill, but still enable users to interact with it, set the polygon fill style to ‘Solid’ and set the opacity of the fill color to a low or zero value.
Inverted Polygons
Pozi sites typically feature a visually appealing polygon layer for the site boundary that serves to focus the user’s attention within the area of interest.
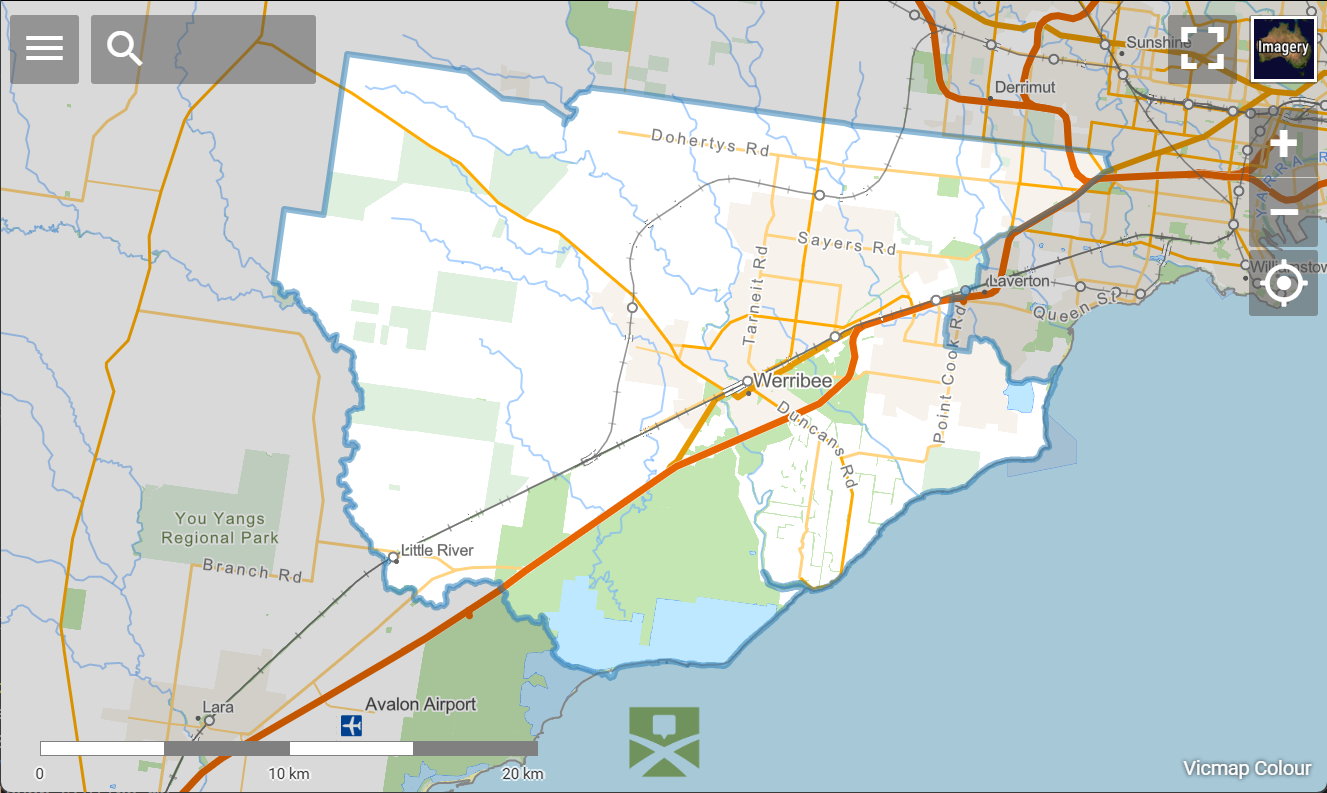
This is achieved using an inverted polygon which creates a region outside the site boundary to which a semi-opaque fill is applied.
Note
QGIS’s built-in symbology type “Inverted Polygons” is not supported by vector layers in Pozi.
Follow the instructions below to create a vector polygon layer.
Add a virtual layer
- Go to Layer > Add Layer > Add/Edit Virtual Layer…
- Click the Add button in the Embedded Layers section to locate and add the layer containing the site boundary.
- In the Query box, use the following SQL (adjusting
your_source_layer_nameto match your actual layer name):
SELECT
    1 AS id,
    ST_Difference(
        ST_GeomFromText('POLYGON((-180 -90, 180 -90, 180 90, -180 90, -180 -90))', 4326),
        ST_Union(geometry)
    ) AS geometry
FROM your_source_layer_name
If the source layer includes features that are not part of the site boundary, add a WHERE clause to select only the individual feature that represents the site boundary.
...
FROM your_source_layer_name
WHERE your_field_name = 'your_boundary_name'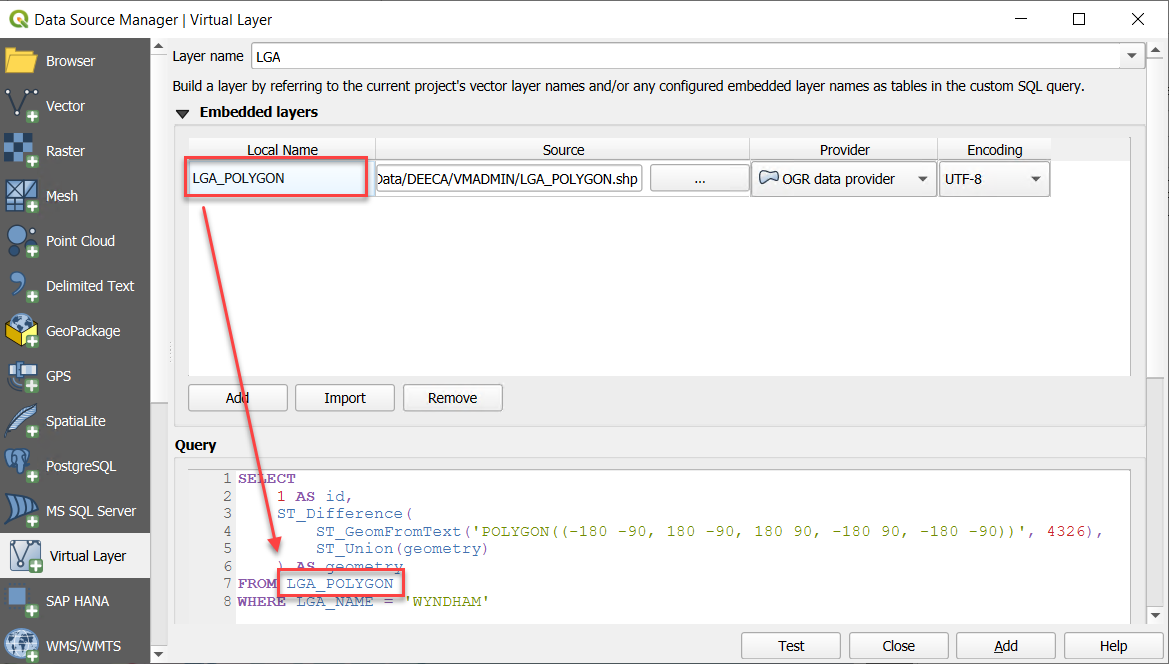
Click Test to confirm the query is valid, and then click Add.
Set styling
Style the new virtual layer as you would any other polygon layer.
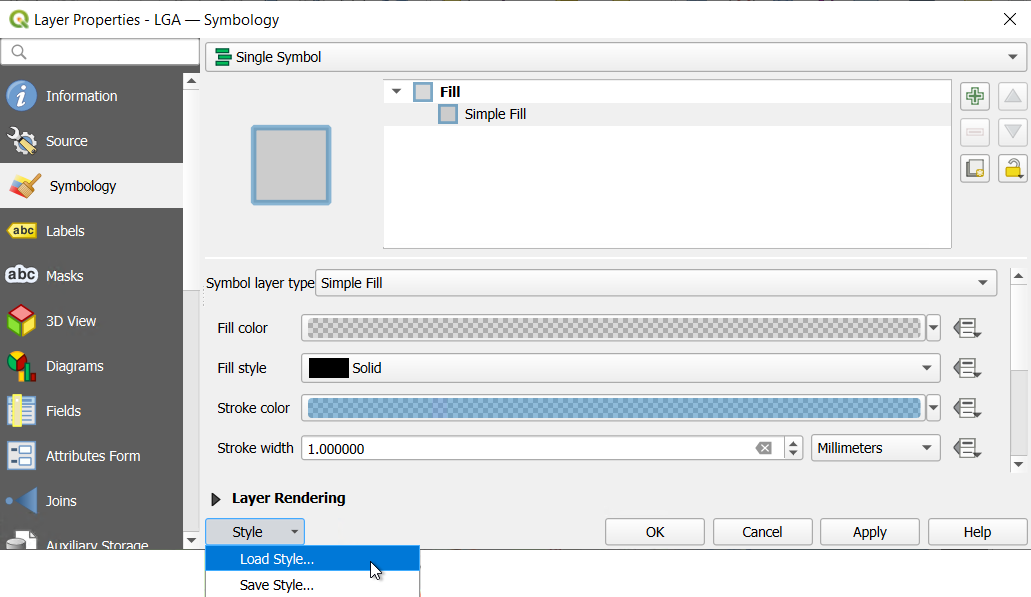
Download the example SLD style suitable for a boundary layer which includes subtle stroke and fill elements.
Go to Layer Properties > Symbology > Style > Load Style > … (select the SLD file) > Load Style.
Adjust the layer’s stroke colour to match your organisation’s style. We recommend using the primary colour from your organisation’s logo.
Set visibility
The boundary layer is most useful when it’s visible by default.
Go to Layer Properties > QGIS Server > Keyword list > add visible=true to the Keyword list.
Optional:
- if you don’t like the look of the legend with the shading inverted, add
showLegend=falseto the Keyword list to hide the legend - if you want to hide the layer from the layer panel altogether, add
showInLayerControl=falseto the Keyword list
When adding multiple keyword settings, use commas to separate them.
Enable WFS
Go to Project > Properties > QGIS Server > WFS/OAPIF > tick ‘Published’ for the layer.
Save
Labels
Point, line and polygon features can be configured to display labels.
To improve legibility, set label text size to 10 points or greater and a white 1.8mm buffer.
Labels can also have a significant effect on render time. Where a fixed placement will do, prefer it over more expensive automatic placement. Use scale-dependent visibility so labels appear only when they are useful, and for polygon labels consider Offset Centroid where appropriate.
Advanced Labels
Any label that relies upon a dynamically generated value must use a virtual field to generate the required text.
For example, if you want the label to combine values from multiple fields, use find-and-replace operations, or convert to upper or lower case, use a virtual field.
A virtual field can also be used to create a label offset, which Pozi does not currently support directly. A label offset is useful for ensuring that labels do not cover point objects.

Example virtual field: "ID" || '\n'
The above example will display the ID of the feature followed by a new line, causing the ID to be pushed up relative to the centre point of the label.

It’s also possible to position the label underneath the feature by changing the virtual field to '\n' || "ID". You can also create extra separation between the label and the feature by adding an extra blank line, eg '\n\n' || "ID".
Tooltips
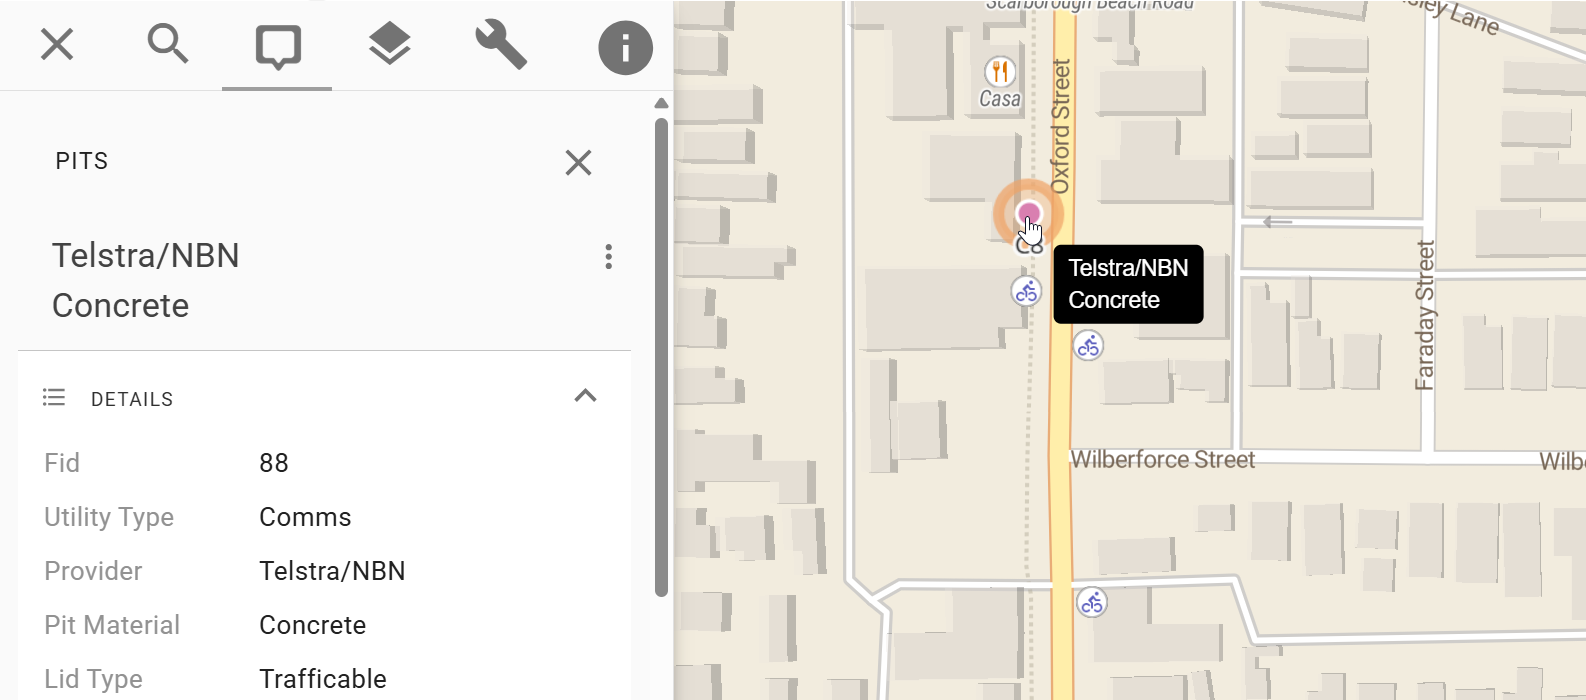
When the cursor hovers over a feature, a tooltip will display an attribute of the feature.
The field used for the tooltip is set in the layer properties, under the Display tab.
Advanced Tooltips
If you want the tooltip to show values from multiple fields, including showing values over multiple lines, use a virtual field for the layer’s Display field.
Note
Tooltips use a different line separator than labels. Use '<br>' to separate lines.
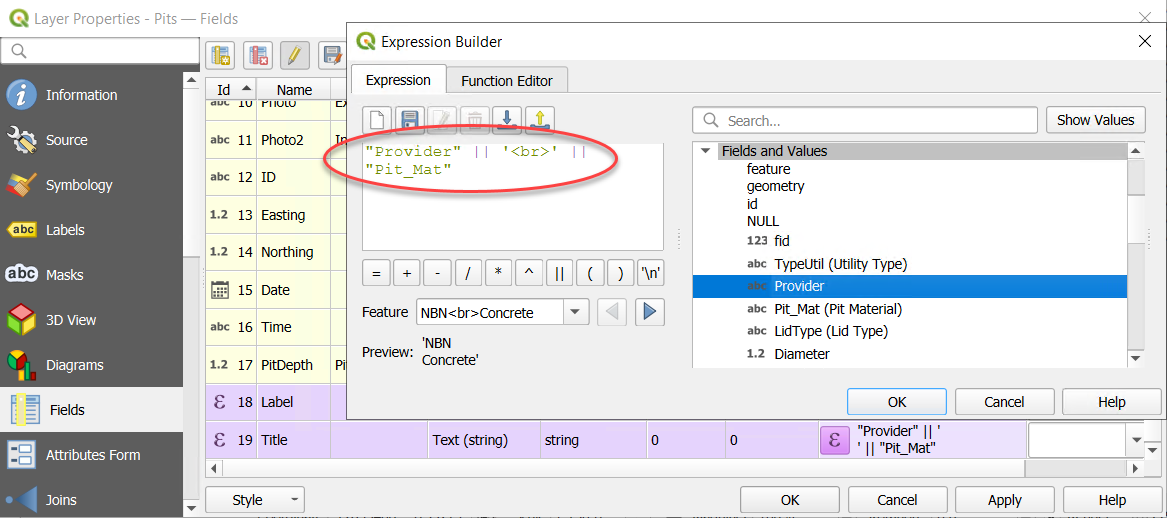
Example virtual field: "Provider" || '<br>' || "Pit_Mat"
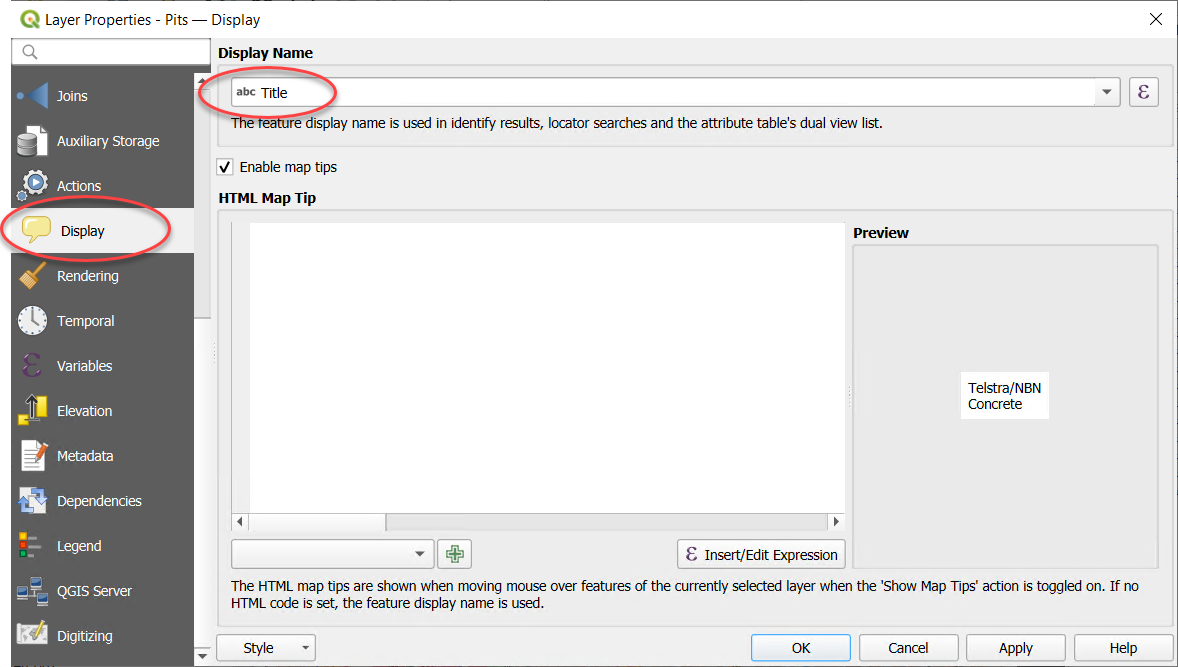
When the layer’s Display field is set to a virtual field with this expression, the tooltip will display the Provider and Pit_Mat values on separate lines.
Embedded Symbology
Layers from MapInfo tables sometimes contain embedded styles. Although QGIS Desktop may recognise and display the features using these styles, QGIS Server is unable to pass on the style to Pozi for styling vector layers.

If the layer’s symbology mode is set to “Embedded Symbols”, switch it to “Single Symbol” or “Categorized”, and style it according to your preference.
Categorized Symbology
Layers can be styled using the Categorized option. Pick the field to use for the category from the drop-down list, then click the Classify button.

Limitations
When publishing the layer as a vector layer, the field used for categorisation must be a field that is exposed (ie, not hidden).
In addition, the following limitations apply:
- the symbology must be based on a field (real or virtual), not an expression
- the values must not be merged (ie, only one value per row)
- the field name must not contain any spaces
You can work around these limitations by creating a suitably named virtual field that contains the required logic.
For instance, the virtual field can contain a case statement to accept any number of input values (from one or more fields) and generate specific values for use in subsequent styling.

See Virtual Fields for more information.
Fallback Style
When using the Classify button to generate styles for each unique value, QGIS automatically generates an additional fallback style for “all other values”. However this function is not supported in Pozi - this style category will be ignored by Pozi.

Opacity
Layer Styling > Layer Rendering > Opacity

Layers are initially displayed in Pozi using the opacity value you’ve set. Users can adjust the opacity up or down from the initial value using the layer’s opacity slider.
Bubble Symbols
Point layers can be displayed using Pozi’s popular bubble symbols.

Ensure that your PC (and the server on which QGIS Server is running) has the Font Awesome icon library installed and configured in QGIS.
Customise Bubble Symbol
- download the sample SLD file
- go to Layer Properties > Symbology > Style > Load Style > … (select downloaded SLD file) > Load Style
- pick icon
- select top SVG Marker item
- set the Fill Color to white (#FFFFFF)
- in SVG browser, select Pozi SVGs
- browse icons or use search box to find icon
- select icon

- pick bubble colour
- select middle SVG Marker item
- click Fill Color to change colour

- OK
Save your project, and preview the layer in Pozi.
Note that the vertical alignment of the icon within the bubble in QGIS may differ slightly to what you see in the Pozi app. What’s important is that the icon displays appropriately in Pozi, even if it looks slightly misaligned in QGIS.
Finding the right icon
The Font Awesome icon library contains thousands of icons to choose from. While you can use the search function within the QGIS SVG browser to search based on an icon filename, you can also use the online Font Awesome search tool to discover icons that match your need, even if your search term doesn’t appear in the icon file name.
Looking for a barbecue icon? Type ‘bbq’ into the Font Awesome online search to see the matching icons. Note that they are named ‘grill’. Now go to the QGIS SVG browser and type in ‘grill’ to find and select the icon.